OpenTelemetry Integration for Agents
What is Observability?
Observability is about understanding what’s happening inside your AI agent by looking at external signals like logs, metrics, and traces. For AI agents, this means tracking actions, tool usage, model calls, and responses to debug and improve agent performance.
Why Agent Observability Matters
Without observability, AI agents are “black boxes.” Observability tools make agents transparent, enabling you to:
- Understand costs and accuracy trade-offs
- Measure latency and performance
- Debug complex agent workflows
- Identify bottlenecks in agent execution
- Continuously improve agent behavior
Implementing OpenTelemetry for Agents
Our agent framework supports OpenTelemetry out of the box, making it easy to instrument your agents and collect telemetry data.
Step 1: Install Required Libraries
pip install 'smolagents[telemetry]'pip install opentelemetry-sdk opentelemetry-exporter-otlp openinference-instrumentation-smolagentspip install langfuse datasetsStep 2: Configure OpenTelemetry
import osimport base64from opentelemetry.sdk.trace import TracerProviderfrom openinference.instrumentation.smolagents import SmolagentsInstrumentorfrom opentelemetry.exporter.otlp.proto.http.trace_exporter import OTLPSpanExporterfrom opentelemetry.sdk.trace.export import SimpleSpanProcessorfrom opentelemetry import trace
# Configure your observability endpoint (example using Langfuse)LANGFUSE_PUBLIC_KEY = "pk-lf-..."LANGFUSE_SECRET_KEY = "sk-lf-..."os.environ["LANGFUSE_PUBLIC_KEY"] = LANGFUSE_PUBLIC_KEYos.environ["LANGFUSE_SECRET_KEY"] = LANGFUSE_SECRET_KEYos.environ["LANGFUSE_HOST"] = "https://cloud.langfuse.com"
# Create authentication headerLANGFUSE_AUTH = base64.b64encode(    f"{LANGFUSE_PUBLIC_KEY}:{LANGFUSE_SECRET_KEY}".encode()).decode()
# Set OpenTelemetry environment variablesos.environ["OTEL_EXPORTER_OTLP_ENDPOINT"] = os.environ.get("LANGFUSE_HOST") + "/api/public/otel"os.environ["OTEL_EXPORTER_OTLP_HEADERS"] = f"Authorization=Basic {LANGFUSE_AUTH}"
# Create and configure the TracerProvidertrace_provider = TracerProvider()trace_provider.add_span_processor(SimpleSpanProcessor(OTLPSpanExporter()))trace.set_tracer_provider(trace_provider)tracer = trace.get_tracer(__name__)
# Instrument your agentsSmolagentsInstrumentor().instrument(tracer_provider=trace_provider)
Step 3: Create and Run an Instrumented Agent
from smolagents import HfApiModel, CodeAgent
# Create a simple agent with instrumentationagent = CodeAgent(    tools=[],    model=HfApiModel())
# Run the agent - telemetry will be automatically collectedagent.run("What is the capital of Germany?")
Trace Structure
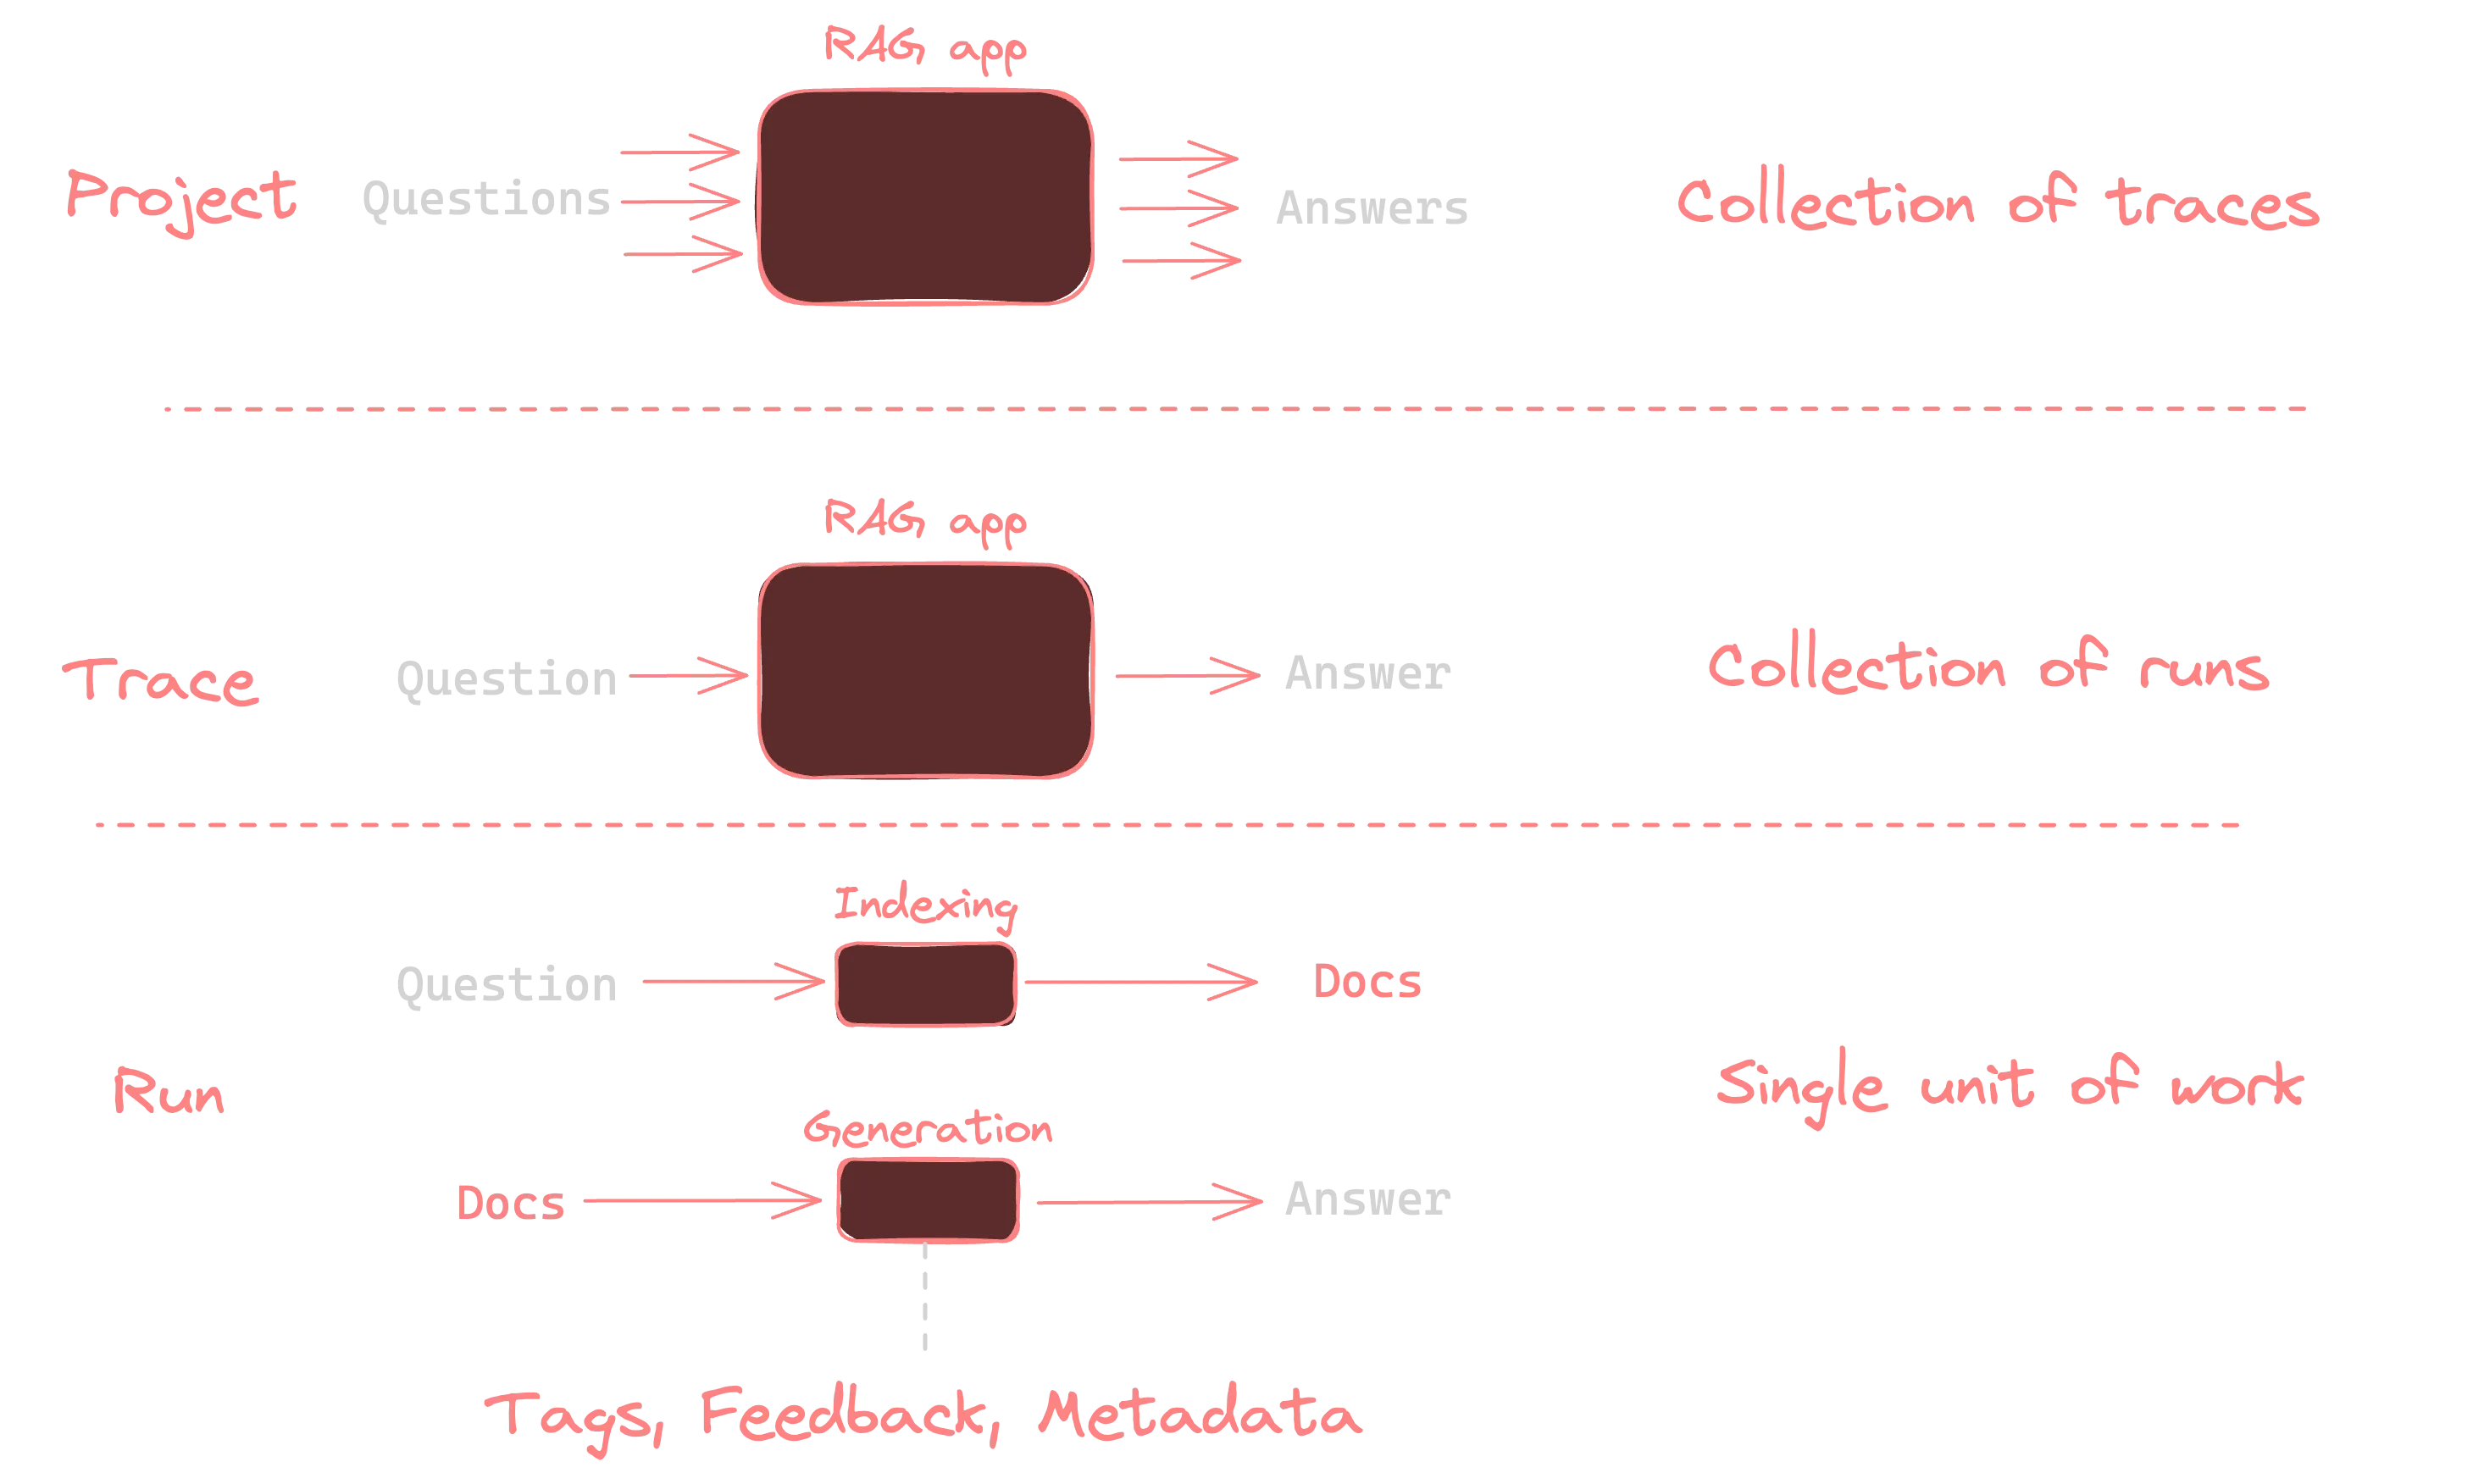
When your agent runs, the observability system captures a hierarchical trace containing:
- The overall agent run as the parent span
- LLM model calls as child spans
- Tool executions as child spans
- Input/output parameters
- Token usage metrics
- Execution time
This structure allows you to analyze the entire agent execution flow and identify bottlenecks or issues.
Key Metrics to Monitor
1. Costs
Our OpenTelemetry integration automatically captures token usage for each LLM call, which can be translated into cost metrics. This allows you to:
- Track per-agent and per-run costs
- Identify expensive agent patterns
- Optimize prompt engineering for cost efficiency
2. Latency
Latency metrics show how long each step of your agent’s execution takes:
- Total response time
- Time spent in LLM calls
- Time spent in tool executions
- Reasoning time between steps
3. Accuracy and Quality
You can enhance your traces with quality metrics:
- User feedback scores
- LLM-as-a-Judge evaluations
- Success/failure markers
- Custom evaluation metrics
4. Additional Context
Enhance your traces with additional attributes:
with tracer.start_as_current_span("Agent-Trace") as span:    span.set_attribute("langfuse.user.id", "user-123")    span.set_attribute("langfuse.session.id", "session-123456789")    span.set_attribute("langfuse.tags", ["customer-support", "billing-query"])
    agent.run("I need help with my subscription")
Evaluation Approaches
Online Evaluation
Online evaluation involves monitoring your agent in production with real user interactions:
- User Feedback: Capture explicit feedback (thumbs up/down) or implicit feedback (rephrased questions)
- Performance Monitoring: Track latency, errors, and completion rates
- A/B Testing: Compare different agent configurations with live traffic
Offline Evaluation
Offline evaluation uses benchmark datasets to systematically test your agent:
# Example: Create a dataset in your observability toollangfuse.create_dataset(    name="support_questions_dataset",    description="Benchmark dataset for support questions",)
# Run your agent against the datasetfor item in dataset.items:    with tracer.start_as_current_span("Dataset-Run") as span:        output = agent.run(item.input["text"])
        # Link the trace to the dataset item        current_span = trace.get_current_span()        span_context = current_span.get_span_context()        trace_id = format_trace_id(span_context.trace_id)
        langfuse.trace(id=trace_id, input=item.input["text"], output=output)
Observability Tools
While our examples use Langfuse, our OpenTelemetry integration works with any OTel-compatible backend:
- Langfuse: Purpose-built for LLM and agent observability
- Jaeger/Zipkin: Open-source distributed tracing systems
- Prometheus: For metrics collection
- Langsmith: Advanced observability and monitoring for AI agents
- LangGraph Studio: Visualization and management of multi-agent systems
- Custom OTel Collectors: For specialized deployments
Conclusion
Implementing OpenTelemetry in your agents provides the transparency needed for production deployments. Our integration makes it easy to collect, analyze, and act on observability data, enabling you to build more reliable, efficient, and effective AI agents.